
How User and Entity Behavior Analytics Detects Hidden Threats
UEBA systems do not look for known malware signatures; they learn normal behavior patterns to flag deviations that indicate compromise.
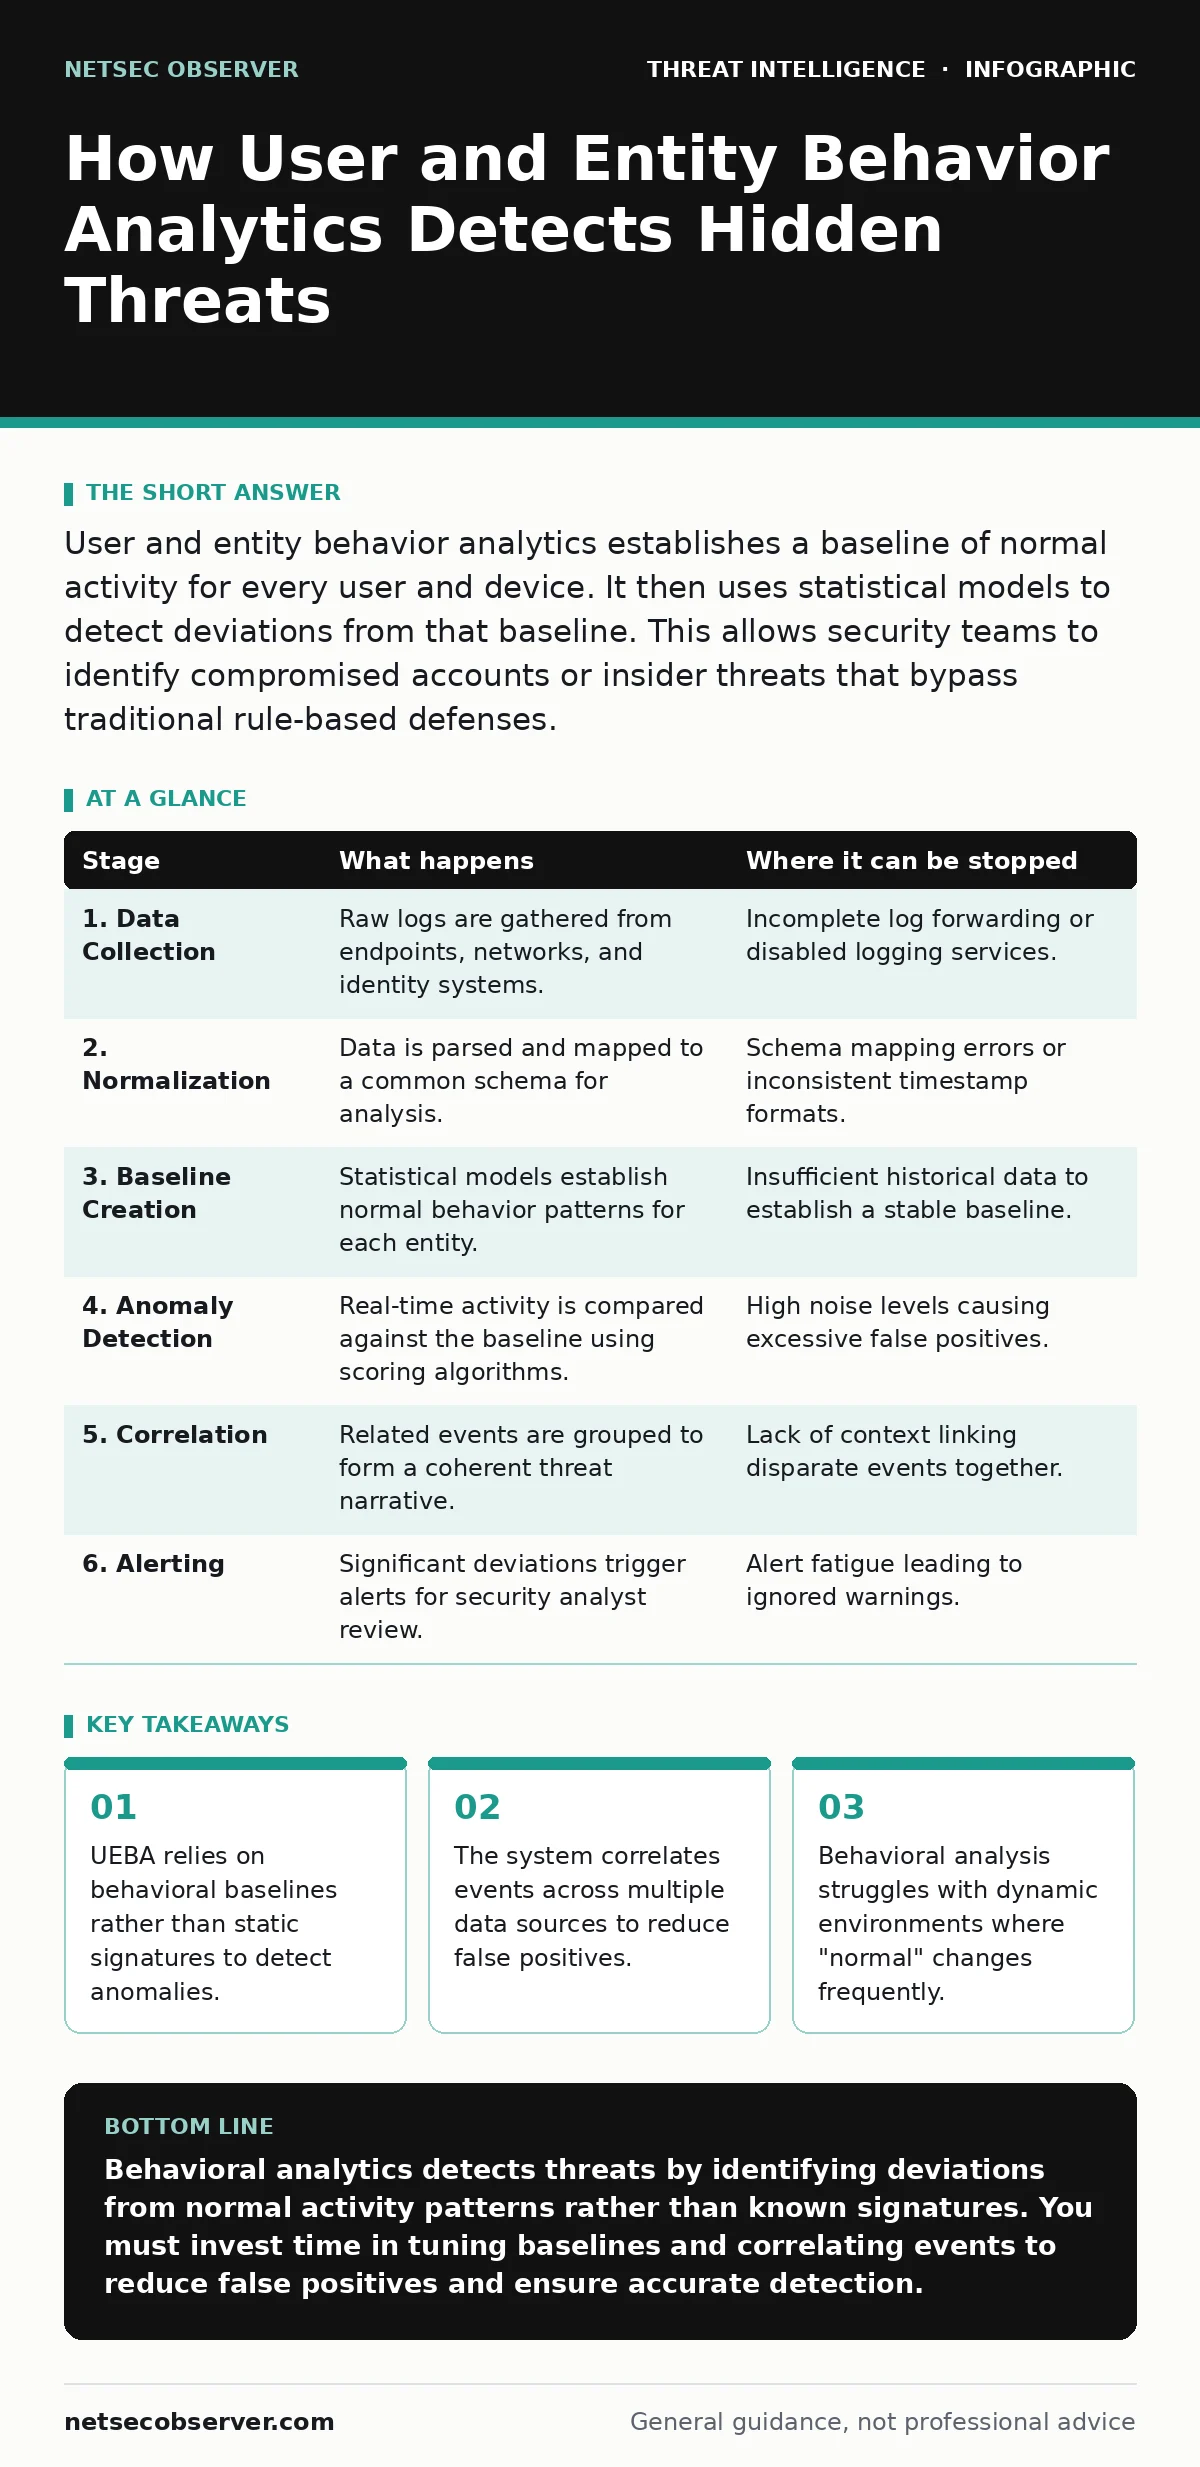
User and entity behavior analytics establishes a baseline of normal activity for every user and device. It then uses statistical models to detect deviations from that baseline. This allows security teams to identify compromised accounts or insider threats that bypass traditional rule-based defenses.
Foundations of Behavioral Detection
Traditional security tools rely on known indicators of compromise. They look for specific file hashes, IP addresses, or command patterns associated with malware. This approach fails when an attacker uses custom tools or legitimate software for malicious purposes. User and entity behavior analytics takes a different path. It assumes that every user and device has a predictable pattern of activity.
The system ingests data from various sources to build a profile of what is normal. It tracks login times, data access patterns, and network connections. When activity deviates significantly from this profile, the system flags it. This method does not require prior knowledge of the specific attack. It only requires a clear understanding of normal operations.
Data Ingestion and Normalization
The process begins with collecting raw data. Security telemetry provides the raw material for analysis. Logs from firewalls, endpoints, identity providers, and applications are sent to a central repository. These logs contain different formats and structures. A firewall log looks nothing like an Active Directory event log.
The system must normalize this data into a common schema. It extracts relevant fields such as user ID, timestamp, source IP, and action type. Missing or malformed data is discarded or flagged. This step is critical because inconsistent data leads to inaccurate baselines. If the input is noisy, the behavioral model will be unreliable.
Establishing the Behavioral Baseline
Once data is normalized, the system builds a baseline for each entity. An entity can be a user, a server, or a application. The baseline represents the expected range of behavior. For a user, this might include typical login hours, usual destinations, and standard file access volumes.
Statistical models calculate mean values and standard deviations for each metric. The system learns that User A usually logs in between 9 AM and 5 PM from a specific subnet. It also learns that User A accesses approximately 50 files per day. This baseline is not static. It updates continuously as new data arrives. The model adapts to gradual changes in behavior, such as a user taking a vacation or changing roles.
Stage 1: Data Collection and Preprocessing
| Stage | What happens | Where it can be stopped |
|---|---|---|
| 1. Data Collection | Raw logs are gathered from endpoints, networks, and identity systems. | Incomplete log forwarding or disabled logging services. |
| 2. Normalization | Data is parsed and mapped to a common schema for analysis. | Schema mapping errors or inconsistent timestamp formats. |
| 3. Baseline Creation | Statistical models establish normal behavior patterns for each entity. | Insufficient historical data to establish a stable baseline. |
| 4. Anomaly Detection | Real-time activity is compared against the baseline using scoring algorithms. | High noise levels causing excessive false positives. |
| 5. Correlation | Related events are grouped to form a coherent threat narrative. | Lack of context linking disparate events together. |
| 6. Alerting | Significant deviations trigger alerts for security analyst review. | Alert fatigue leading to ignored warnings. |
Real-Time Anomaly Scoring
As new events occur, the system compares them against the established baseline. It assigns an anomaly score to each event. A score of zero indicates perfectly normal behavior. Higher scores indicate greater deviation. Logging in at 3 AM from a foreign country might receive a high score. Accessing a sensitive database for the first time might also score high.
The system uses various statistical techniques to calculate these scores. Some methods look at frequency, while others examine sequence. A user who suddenly downloads 1,000 files instead of 50 is flagged. The system does not care why the files were downloaded. It only cares that the volume is abnormal. This allows it to catch data exfiltration attempts that use legitimate tools.
Contextual Correlation
Single anomalies are often benign. A user might work late occasionally. The system must correlate multiple anomalies to identify true threats. It looks for clusters of suspicious activity. If a user logs in from a new location and immediately accesses sensitive data, the combined score increases.
This correlation reduces false positives. It distinguishes between a user having a bad day and an attacker moving laterally. The system might reference the MITRE ATT&CK framework to map observed behaviors to known tactics. This helps analysts understand the potential intent behind the anomalies. It transforms raw scores into actionable intelligence.
See also: Honeytokens Explained: Silent Traps for Data Breaches · Detect Spear Phishing: Log Signals and Hidden Attack Vectors
Limits of Behavioral Analysis
Behavioral analytics is not a silver bullet. It struggles in dynamic environments where normal behavior changes rapidly. New employees, onboarding processes, and seasonal business spikes can create noise. The system may flag legitimate changes as threats. This leads to alert fatigue, where analysts ignore warnings.
The system also requires a significant amount of historical data to build accurate baselines. In the first few weeks of deployment, it will generate many false positives. Tuning the system to reduce noise takes time and expertise. Additionally, sophisticated attackers who move slowly and mimic normal behavior may evade detection. They stay within the statistical bounds of "normal."
Integration with Incident Response
When the system detects a high-confidence threat, it triggers an alert. This alert should integrate with your incident response runbooks. The alert provides context about the anomalous behavior. It tells the analyst which entity is involved and what actions were taken.
Analysts use this information to investigate further. They may isolate the affected device or disable the compromised account. The goal is to contain the threat before it causes damage. Behavioral analytics provides the early warning, but human judgment is required to determine the appropriate response. Automation can speed up containment, but it must be carefully configured to avoid disrupting business operations.
Hidden Costs and Trade-offs
Implementing behavioral analytics requires significant infrastructure. You need storage for large volumes of log data. You need processing power to run statistical models in real time. This adds cost and complexity to your security stack. The system also requires ongoing maintenance. Baselines must be reviewed and adjusted as business processes change.
There is also a privacy consideration. The system monitors every action taken by users. This can create tension between security and employee privacy. Clear policies must define what data is collected and how it is used. Transparency helps maintain trust. Without it, the system faces resistance from staff and legal challenges.
Key takeaways
- UEBA relies on behavioral baselines rather than static signatures to detect anomalies.
- The system correlates events across multiple data sources to reduce false positives.
- Behavioral analysis struggles with dynamic environments where "normal" changes frequently.
Behavioral analytics detects threats by identifying deviations from normal activity patterns rather than known signatures. You must invest time in tuning baselines and correlating events to reduce false positives and ensure accurate detection.
Frequently asked questions
How long does it take for UEBA to build an accurate baseline?
It typically takes several weeks of consistent data collection to establish reliable baselines. During this period, expect a higher rate of false positives as the model learns normal behavior patterns.
Can UEBA detect insider threats?
Yes, UEBA is effective at detecting insider threats because it focuses on behavioral deviations. It can identify employees who access data outside their normal patterns or use credentials in unusual ways.
Does UEBA replace traditional antivirus software?
No, UEBA complements traditional security tools. It detects behavioral anomalies that signature-based tools miss, but it does not scan for known malware or patch vulnerabilities.
How do I reduce false positives in UEBA?
Regularly tune your thresholds and exclude known legitimate deviations. Use correlation rules to group related events and refine baselines based on feedback from security analysts.
How this guide was produced: written by the NetSec Observer editorial team with AI assistance, checked against the public references listed below, and reviewed when the facts change. See our editorial policy or report an error.