Security Telemetry Explained: How to Turn Raw Data into Actionable Insight
Raw telemetry is useless noise until you apply context, which transforms random system events into a clear picture of attacker behavior and intent.
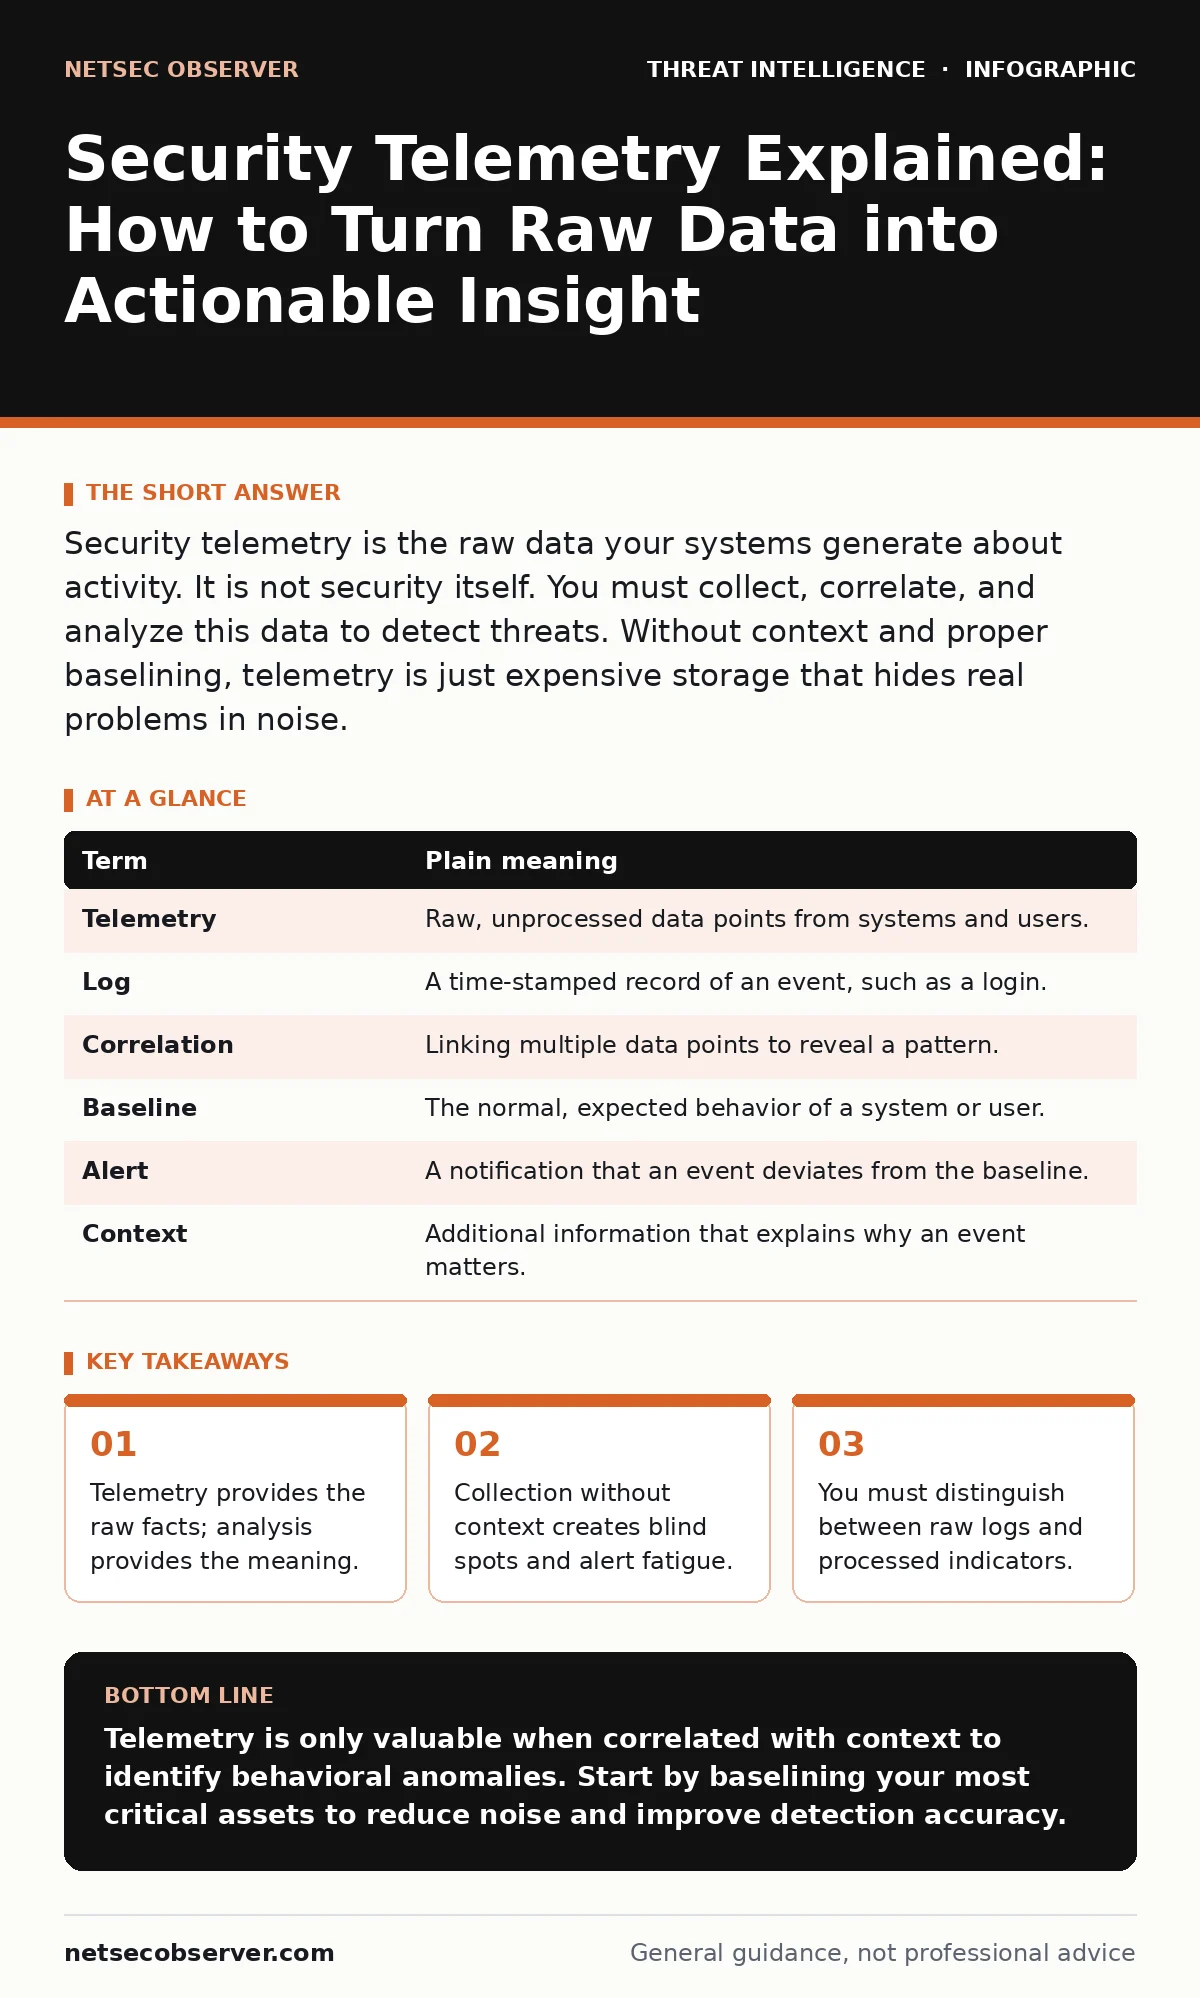
Security telemetry is the raw data your systems generate about activity. It is not security itself. You must collect, correlate, and analyze this data to detect threats. Without context and proper baselining, telemetry is just expensive storage that hides real problems in noise.
The Airport Security Analogy
Imagine an international airport. Thousands of passengers move through terminals every hour. Security cameras record every face, every bag, and every step. This raw video feed is your security telemetry. It is the unprocessed data generated by your environment.
The cameras do not tell you who is dangerous. They only tell you who is present. If you watch every feed simultaneously, you will miss the threat because your brain cannot process that volume. You need a system to filter and highlight anomalies.
Telemetry works the same way in cybersecurity. Your servers, endpoints, and networks generate massive amounts of data. This data includes login attempts, file access, and network connections. By itself, this data is inert. It does not protect you. It only records what happened.
Defining the Core Terms
Many beginners confuse the data with the analysis. You must separate the raw signal from the interpreted meaning. Here is how the industry distinguishes these concepts.
| Term | Plain meaning |
|---|---|
| Telemetry | Raw, unprocessed data points from systems and users. |
| Log | A time-stamped record of an event, such as a login. |
| Correlation | Linking multiple data points to reveal a pattern. |
| Baseline | The normal, expected behavior of a system or user. |
| Alert | A notification that an event deviates from the baseline. |
| Context | Additional information that explains why an event matters. |
Telemetry is the input. Correlation is the process. The alert is the output. If you skip correlation, you are just reading logs manually, which is impossible at scale.
The Noise Problem
The biggest mistake is collecting everything without a plan. This is like recording every conversation in the airport. You will capture the threat, but you will also capture thousands of hours of mundane chatter. This is alert fatigue.
When you receive hundreds of alerts daily, you start ignoring them. You assume they are false positives. A false positive is an alert that flags normal activity as malicious. This happens when your baseline is wrong or too broad.
You must define what "normal" looks like before you can spot "abnormal." If a server usually sends one megabyte of data per hour, and it suddenly sends ten gigabytes, that is an anomaly. If you do not know the baseline, you will not notice the change.
Correlation and Context
Raw telemetry lacks context. A single login from a new IP address might look suspicious. But if that login happened because the user traveled for work, it is benign. This is where open-source intelligence (OSINT) helps. You can cross-reference the IP address with public data to see if it belongs to a known hotel or corporate office.
You also need to look at the sequence of events. A single failed login is noise. Ten failed logins followed by a successful one is a pattern. This pattern suggests a brute-force attack. You are no longer looking at data points; you are looking for indicators of attack.
This is different from static indicators. Static indicators, like a known bad file hash, tell you what happened in the past. Indicators of attack tell you what an adversary is trying to do right now. They are behavioral, not just factual.
The Hidden Cost of Storage
Telemetry is heavy. Storing it for years costs money. Many organizations keep data for compliance reasons, not security reasons. This creates a hidden cost: the time spent searching through irrelevant data during an investigation.
If you store everything, you must also process everything. This slows down your detection engines. You need a retention policy that balances cost with utility. Keep high-value data, like authentication logs, longer. Discard low-value data, like routine health checks, sooner.
This trade-off is critical. You cannot keep everything. You must choose what matters. If you do not know what you need for incident response runbooks, you will keep the wrong data.
See also: Honeytokens Explained: Silent Traps for Data Breaches · Detect Spear Phishing: Log Signals and Hidden Attack Vectors
Behavioral Analysis and Frameworks
To make sense of telemetry, you need a framework. The MITRE ATT&CK framework provides a common language for attacker behavior. It maps techniques to tactics. When you see a specific command execution, you can map it to a known technique.
This allows you to use user and entity behavior analytics effectively. Instead of looking for a specific bad file, you look for a user acting like an attacker. For example, a user accessing files they never touch before is a behavioral anomaly.
This approach is more resilient than signature-based detection. Attackers change their files to avoid signatures. They rarely change their behavior. Stealing data always looks like data exfiltration, regardless of the tool used.
Try This Now
You can improve your telemetry posture immediately. Follow these three steps to reduce noise and increase clarity.
- Define your crown jewels. Identify the three most critical assets in your environment. Ensure you are collecting detailed telemetry for these specific assets only.
- Establish a baseline. Pick one critical server. Monitor its network traffic and CPU usage for a week. Write down the average values. This is your baseline for normal behavior.
- Test your alerts. Simulate a benign anomaly, such as a large file transfer. Check if your system generates an alert. If it does not, adjust your thresholds. If it generates ten alerts, refine your rules to reduce noise.
Connecting the Dots
Telemetry is the foundation, not the solution. You must build analysis on top of the data. Look for patterns, not just events. Use frameworks to structure your thinking.
Remember the airport. The cameras are useless without the security team watching the screens and interpreting the footage. You are the security team. Your job is to turn raw data into actionable insight.
Key takeaways
- Telemetry provides the raw facts; analysis provides the meaning.
- Collection without context creates blind spots and alert fatigue.
- You must distinguish between raw logs and processed indicators.
Telemetry is only valuable when correlated with context to identify behavioral anomalies. Start by baselining your most critical assets to reduce noise and improve detection accuracy.
Frequently asked questions
What is the difference between a log and telemetry?
A log is a specific type of telemetry that records events in a text format. Telemetry is the broader category, including metrics, traces, and logs.
Do I need a SIEM for telemetry?
A SIEM helps aggregate and correlate telemetry from multiple sources. You can analyze telemetry without one, but it becomes difficult at scale.
How long should I keep telemetry?
Keep high-value authentication and access logs for at least a year. Discard low-value performance metrics after a few weeks to save costs.
Is telemetry the same as monitoring?
Monitoring is the act of observing telemetry. Telemetry is the data itself. You monitor telemetry to detect issues.
How this guide was produced: written by the NetSec Observer editorial team with AI assistance, checked against the public references listed below, and reviewed when the facts change. See our editorial policy or report an error.